Welcome to the 9th validated release of the QbDVision platform. Have you wondered why some of the biggest pharma and biotech companies in the world are using QbDVision to drive their CMC digital maturity? Because we keep delivering the answers to the question of “How”?
- How can I seamlessly manage patient, product, and process requirements?
- How can I track the evolution of my manufacturing process?
- How can I efficiently manage our organization’s CMC knowledge?
In this latest release, QbDVision helps you answer another critical question posed by the ICH Q8 guidelines. Wondering what that is? Read on to find out more and learn how QbDVision continues to be the leader in Digital CMC innovation with new reports, new features, and updates.
Control Strategy
Continued Innovation on Control Strategy
So what was that critical question from ICH Q8…? Time to geek out a little on the ICH guidelines. Section 2.5 of the ICH Q8(R2) Annex guidelines states:
"The elements of the control strategy discussed in Section P.2 of the dossier should describe and justify how in-process controls and the controls of input materials (drug substance and excipients), intermediates (in-process materials), container closure system, and drug products contribute to the final product quality."
ICH guidelines
The common response is, “ok, but how?” How do I easily track and describe this? One of the things we really do well at QbDVision is to help you with the “How”. In our last validated release, we introduced the concept of Control Strategy tags for your product and process variables. For example, with these new tags, you can easily generate a list of all CQAs that are to be tested at release. In this software release, we have advanced our grand plan of holistic Digital Control Strategy management as the next pillar of the Digital CMC vision. Let’s check it out!

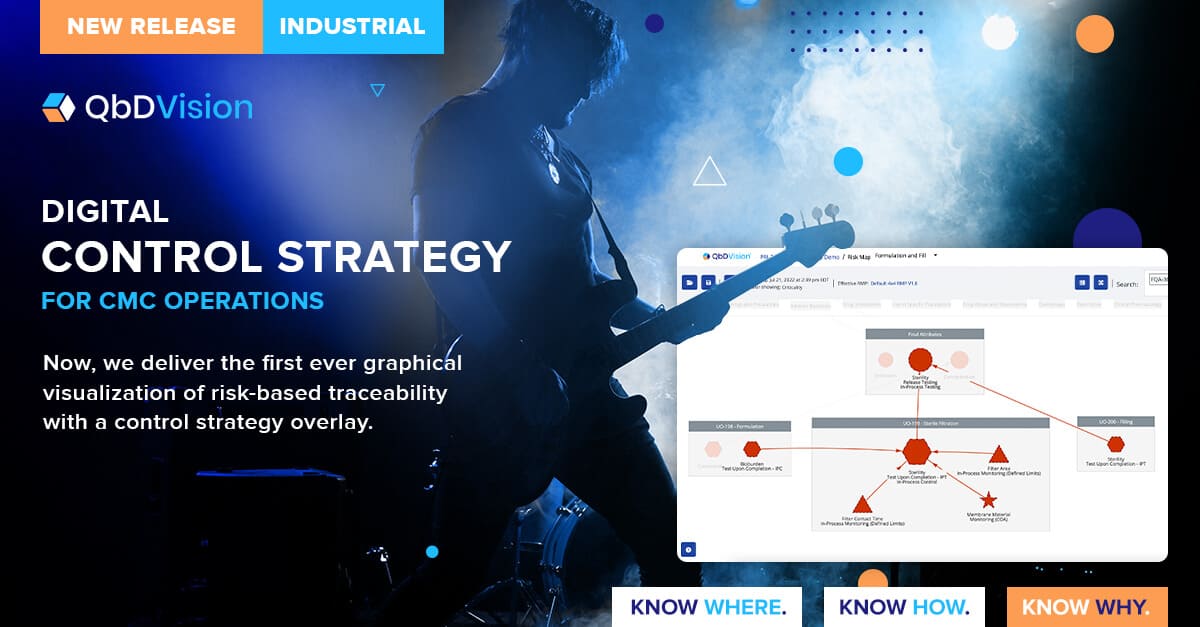
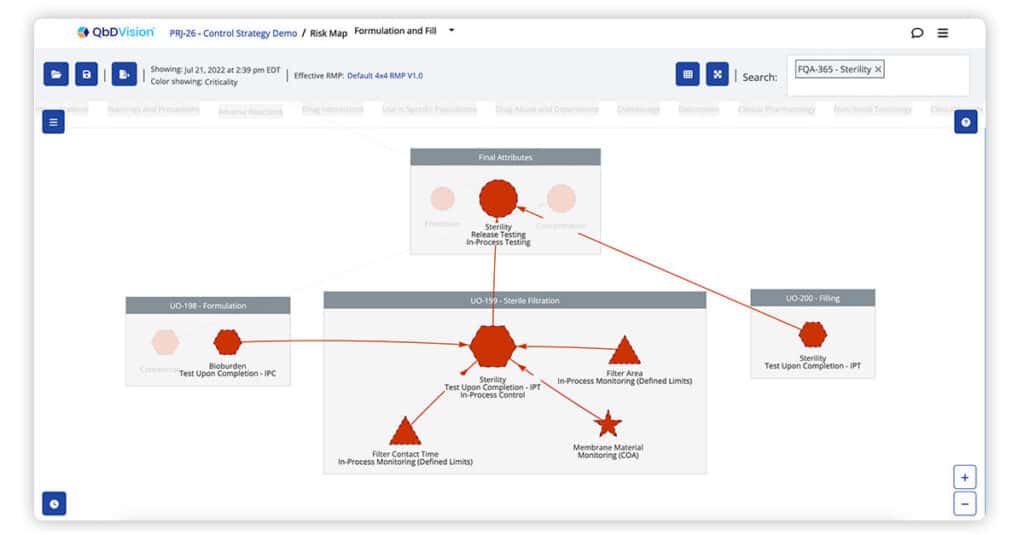
QbDVision pioneered the graphical visualization of risk-based traceability. Now, we deliver the first ever graphical visualization of risk-based traceability with a control strategy overlay. Get instant clarity on the variables that impact CQAs, the risks of these variables, and how each of these are controlled whether this is with in-process tests, in-process controls, or real-time monitoring.

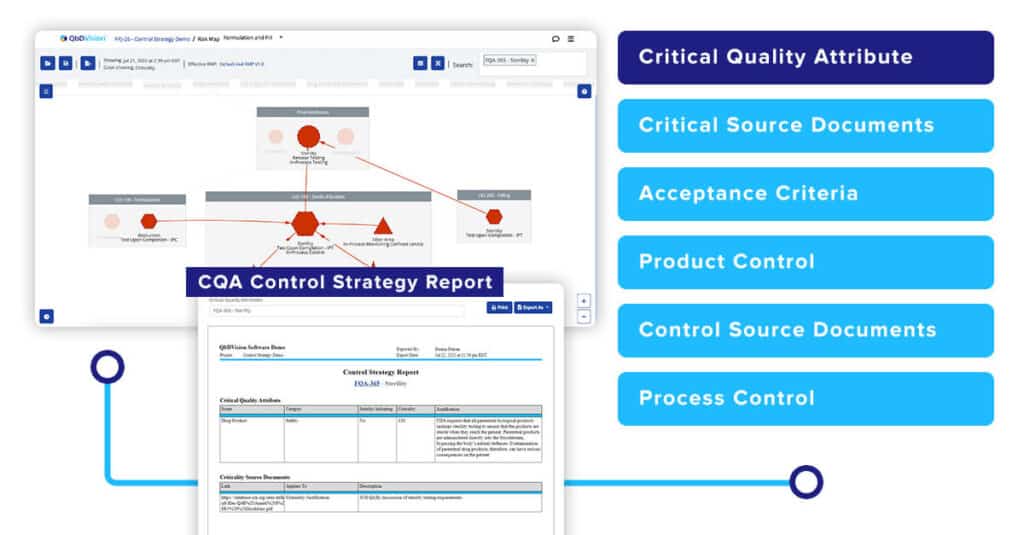
While pictures are great, they do not always provide the full context. To address this, you will now be able to generate a full CQA Control Strategy Report. This report provides more context by converting the risk map into a formal text-based report providing all the details on how that CQA is being controlled.

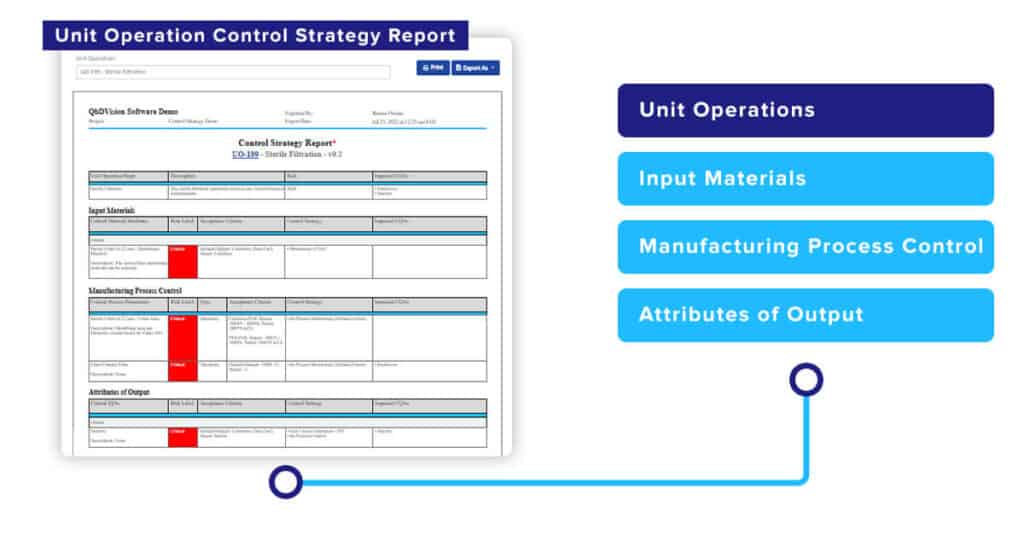
A control strategy report for a Unit Operation, including all of its Steps can now also be created automatically with a push of a button. The Unit Operation Control Strategy Report provides a different perspective on all of the critical process-related controls for a specific Unit Operation. It shows how Critical Material Attributes and Critical Process Parameters are managed and controlled to produce the required outputs and their impact on downstream CQAs.

Process capability information can now be overlaid on risk maps. The control strategy overlay on risk maps is color coded based on Cpk value calculated from user-selected batch data. These two pieces of information provide a visual summary of risk and process capability together to help you better evaluate the state of control.

In-Process Controls can now be added to Intermediate and Final Performance and Quality Attributes.
While Control Strategy is a big part of this validated release, we would like to also highlight even more new exciting features, enhancements and updates to the following Digital CMC components. Continue reading for more details.
Process Order
Sort and see your data in a meaningful way

The sorting function has been updated to display information in order of process as opposed to alphabetical order for improved usability. This was updated for multiple fields in multiple locations:
Process Explorer
The table view for the following fields:
- Process Parameters
- Steps
- Unit Operations
Tech Transfer
The table view for the following fields:
- Steps
- Unit Operations
Process Data Uploads
The table view for the following fields within exported templates:
- Process Parameters
- Steps
- Unit Operations
Also updated throughout the Failure Mode and Effects Analysis (FMEA) report
Dynamic Tables
Better data, smarter organization, faster results

Both product and process dynamic tables now export all specified acceptance criteria ranges and not just the reporting range when exporting to Excel.

All supporting source document information will now be exported collectively into a separate Excel tab. This makes it easier to organize references.

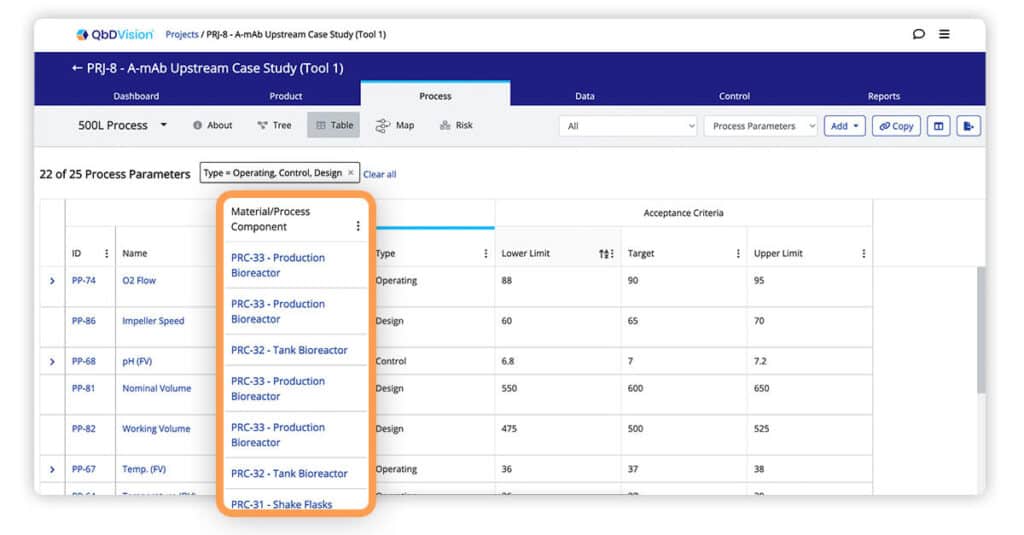
Parent Material and Process Components are now visible when using the table view to look at associated Process Parameters and Material Attributes.

The Scope field is now visible as a column in the dynamic tables module for Product to see if the quality attribute applies to Drug Substance, Drug Product, or both.
Risk Management Plan
Improving your ability to manage risk by seeing the bigger picture

For added convenience and efficiency, the risk management report now displays calculated risk tables and a definition list for:
- Process Parameters
- Steps
- Unit Operations

Risk management report appendices now display the risk label as well as the score label. Previously, it only showed the score label.

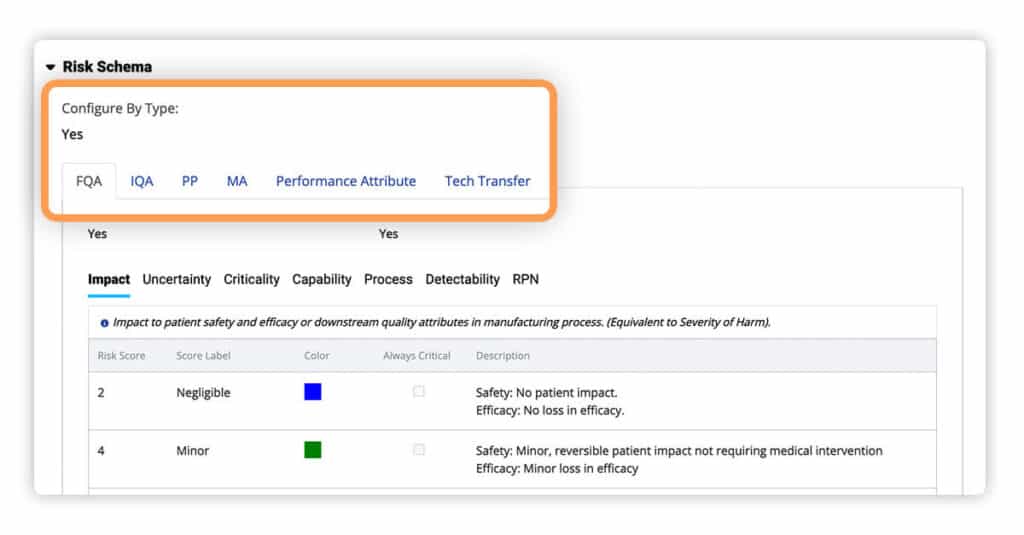
New Risk Management Plans (RMPs) now default to the “By Type” configuration. This allows users to set up the five customizable schema types now available for use – Final Quality Attributes, Intermediate Quality Attributes, Process Parameters, Performance Attributes, and Tech Transfer.

For efficiency and ease of use, the “By Type” configurations of one risk schema can now be copied into sections of other record types. This capability allows you to create new RMPs dramatically faster.
Integration Capabilities
API integration for greater upload efficiency

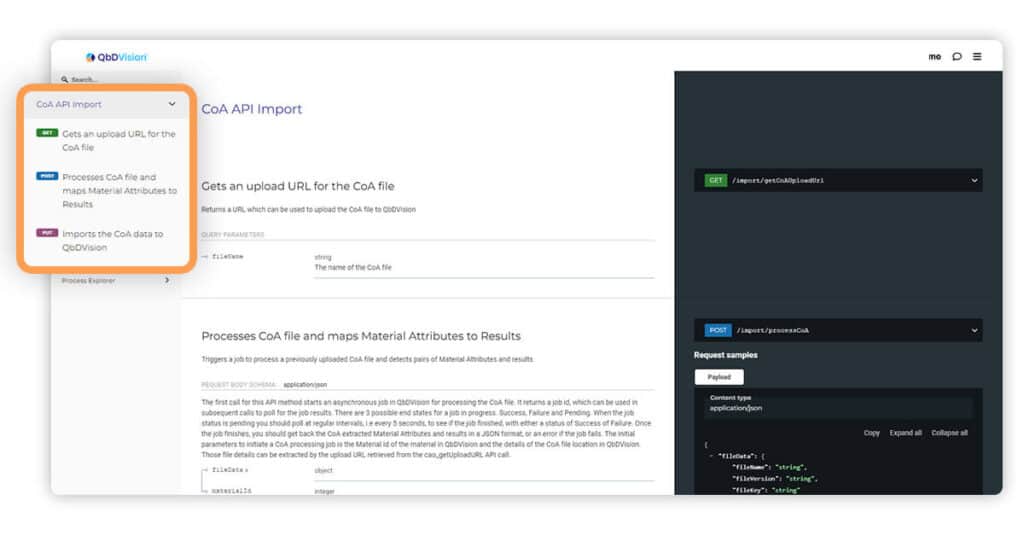
We have improved support and documentation for uploading Certificate of Analysis (CoA) files via our Application Programming Interface (API). This now allows you to upload CoAs in large offline batches.

Unit Operation is now returned in the Process Explorer API endpoint for the following responses:
- Materials
- Material Attributes
- Intermediate Quality
- Performance Attributes
- Process Components
- Process Parameters
- Steps
Import Templates
Simplifying getting started

Suppliers can now be added to imported CoAs when using the import wizard. This eliminates the need for having to go back to the data record for the information.

Control methods can now be associated to multiple record types while importing.
- Final Quality & Performance Attributes
- Intermediate Quality & Performance Attributes
- Material Attributes
- Process Parameters

A Control Methods column has been added to the Excel import templates and is available for both new and existing templates.

Final and Intermediate Performance Attributes can now be imported via an Excel upload. Previously, users could only create and update these via the user interface.
You Asked, We Heard, We Delivered
While all of our new and improved features are customer-driven, we would like to specifically call out the following direct asks from you:

Drug Product & Drug Substance and Raw Material were added as options in the Project Type field. This allows users to create combined Drug Substance and Drug Product projects.

A Scope field has been added to Final Performance Attributes, with the following options: Drug Substance and Drug Product.

Purity-Adventitious Agents has been added as a selection for the Category field of Final Quality and Performance Attributes.

The default risk for a Unit Operation has been changed to “unknown”. Previously the default was “very high” which could be inaccurate if users did not initially set this field.

The following fields were added to drug substance and drug product data records:
- Purpose
- Type
- Supplier (to both batch and CoA records)

The Process Analytics Dashboard has been updated to display the Purpose, Type, and Supplier fields from the corresponding Data record. These fields are now visible in both the subgroup selection panel and the subgroup table at the bottom of the report.

The Category field for a Material Record has been updated to include the following selections:
- Buffer
- Buffer Component
- Media
- Feed
Personalized Demonstration
Show Me How QbDVision Works
This release was driven by the valuable feedback of people like you. You can always make a feature request through our customer support portal. Schedule a walk-through and unlock capabilities for you and your team.
Don’t Miss Out
2022 Digital CMC Summit
This November, we will launch the 1st Annual Digital CMC Summit, live and in person. Hear from global thought leaders and industry experts who are reshaping the way product and process teams develop and deliver life-changing therapies.
