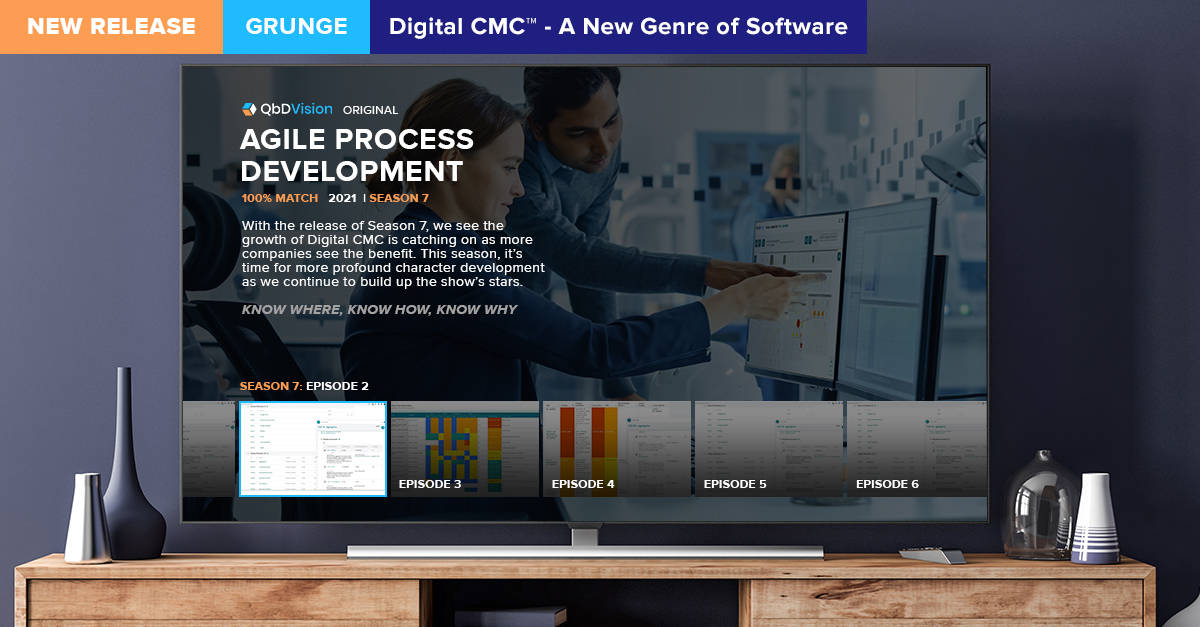
In Season 6 of the QbDVision Software Release Series, we introduced you to ways of streamlining your key workflows and advancing the theme of Digital CMC™ within your organization.
With the release of Season 7, we see the growing desire to deploy digital technologies in the search for CMC Nirvana. This season, it’s time for more profound character development as we continue to build up the show’s stars.
Episode 1: Smells Like Tech Transfer Spirit
Did you know that pharma/biotech companies only use about 4% of their data on average? Yes, it’s true, but probably not surprising to many of you with the prevalence of information silos in many organizations.
In our last release, we introduced the Digital Tech Transfer capability for the first time, leveraging our structured framework to simplify this workflow. Picking up where we left off last season, tech transfer is at the forefront of this release.
Based on continuous usage and feedback across our customer base, we continued to expand our capabilities to include:
Comparison Customization. The comparison module now lets you customize which fields are tracked for changes. It goes even further to allow different comparison schemes for different variable types.
Better than Excel. We’ve added new support for sorting and filtering so you can customize your tech transfer views and see what matters to you.
Shareable views. Once you have sorted and filtered your table to focus on the information that matters, share the specific URL with coworkers so they can see the exact same view.
Smart exports. Export what you see on the screen to take it with you, including your filters and sorting.
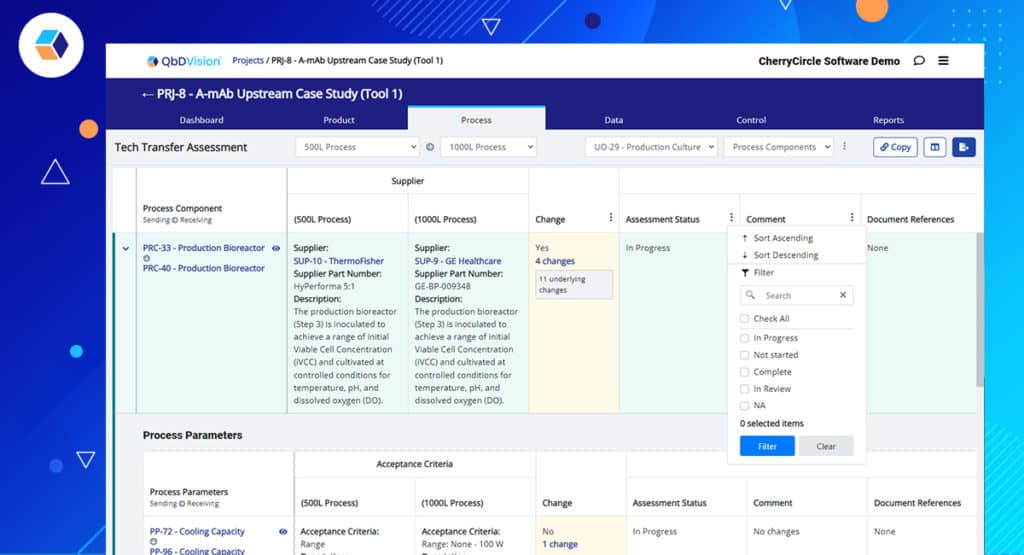
Teaser: In season 8, we will expand this report customization capability to many other parts of the software. Stay tuned.
Episode 2: Come as You Are, But Go Faster
As with any excellent TV Series in its 7th session, our not so front-and-center but critical characters must get TV time. This episode is all about speed.
Throughout our series, we’ve added hundreds if not thousands of features to our platform. Our users are finding newer and more imaginative ways to use the platform to rapidly digitize their workflows and information. We are excited by the many great ideas our customers share about making QbDVision even more powerful.
That said, now and then, we need to spend the effort to make the platform snappier. After all, one of our primary goals is to save our users time, and thus it’s crucial to make our application both powerful and fast.
We threw the book at performance, achieving gains of up to 70% in load times of specific pages and a 25% gain across the board.
Our improvements include:
- Introduction of progressive page loading
- Additional provisioned hardware (CPU & Memory) for physical performance gains
- Optimized our page loading strategy for fewer network calls
- Optimized database connection performance
The first improvement, progressive page loading, is where users will see the most prominent benefit. When most pages or reports in the application load, we’re pulling together all sorts of connections about a particular record, looking up – information, risk, related batches, related records, historical updates, etc. With progress page loading, users can start engaging with the application once the first bit of information is ready. Previously, we waited until all that information was downloaded to your browser, causing some users to have to wait. Each page is ready in a snap, and users can continue using the application while their other data loads.
There’s, of course, more to this story in future episodes.
Episode 3: Atomic Number 3
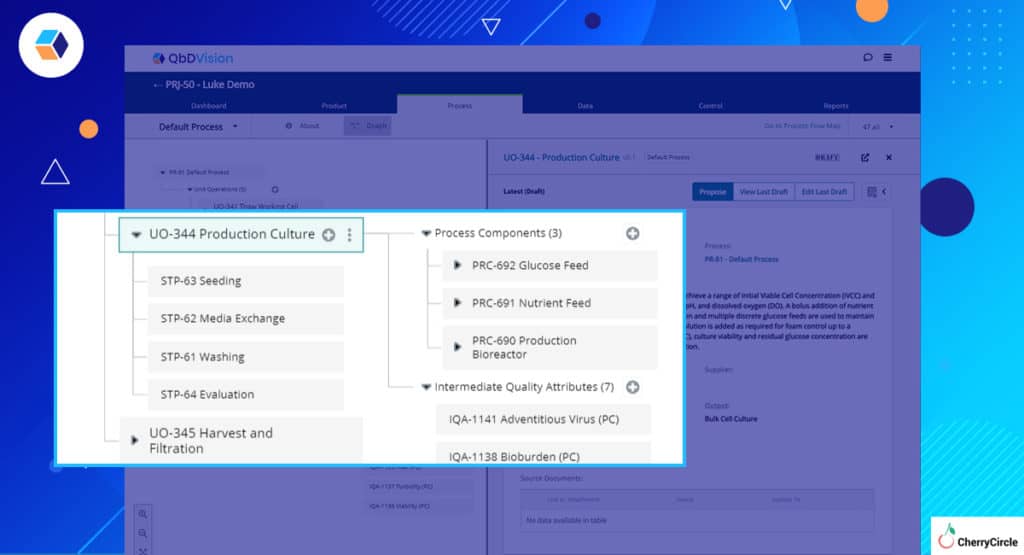
In the last season, we introduced Steps into our process model. Steps have been highly adopted as a way to bring more organization to a unit operation. Whether our users call them a “step,” a “phase,” or a “process action,” the feature has been met with considerable fanfare.
We have upgraded our setup process to allow users to import steps during creation and when updating their values, making it easier for new projects to get off the ground using steps.
Now users can:
- Create steps under unit operations via a separate Excel upload
- Assign process components, materials, process parameters, and material attributes to a step via the upload process.
Episode 4: Lounge Act
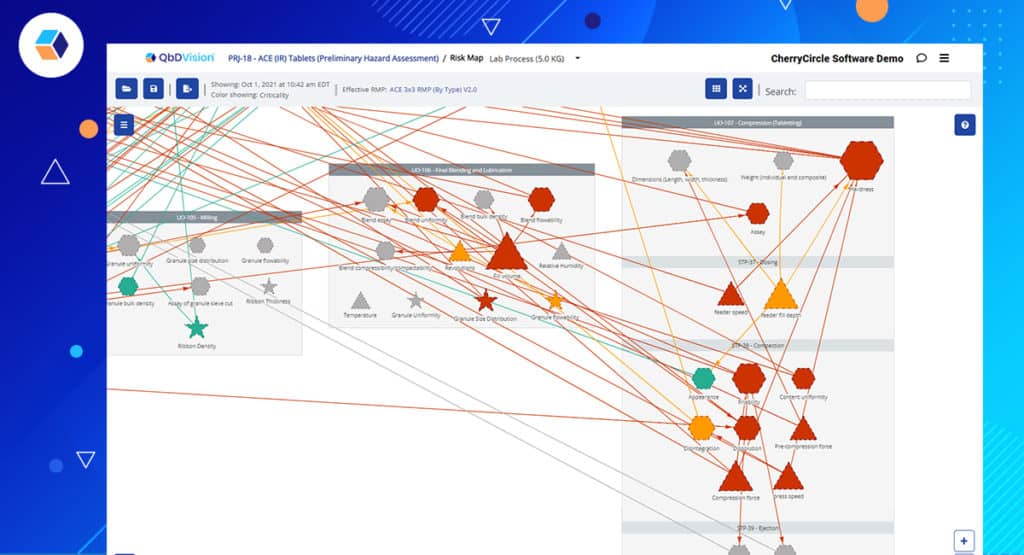
Building on the last episode, we’ve also upped our game with additional reporting and visualizations for steps.
Remember the joy of generating a Process Flow Map with the click of a button? Now, this map breaks out the linear input to output mapping by steps as well as unit operations. The Risk Map provides the all-important, nonlinear traceability view from each input to each output. Now, the Risk Map will automatically segregate variables within a unit operation by steps providing more valuable information.
Finally, take steps into account during tech transfer evaluation as well. Our tech transfer reporting is upgraded to work with the new Step functionality making scale-up and process transfer even quicker. Whether you’re visualizing steps or comparing step differences, it’s now faster and easier for you.
Season Finale: Endless, Nameless
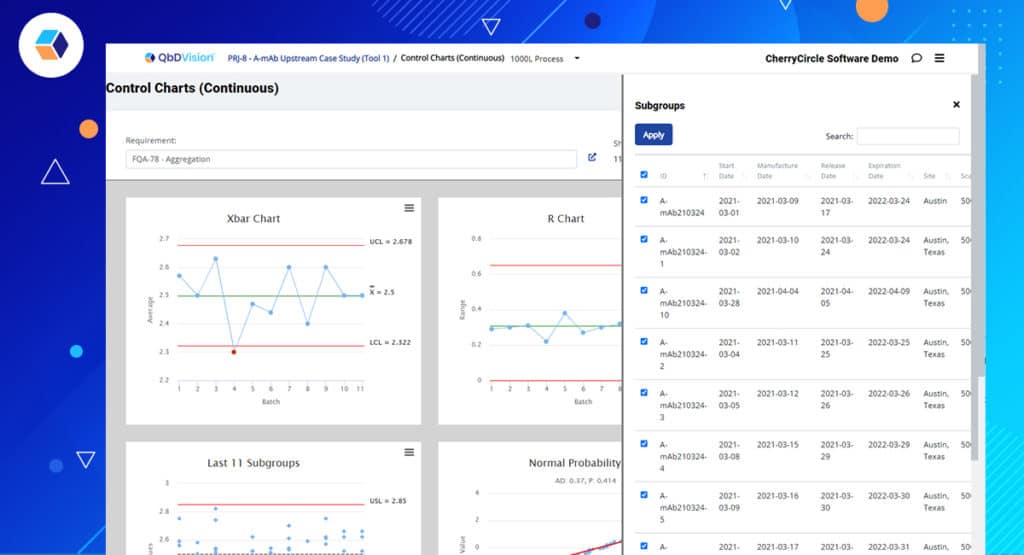
Going further with character development, in this episode, we explored our process analytics module in detail. While we didn’t add any front-end charts and graphs, we overhauled our statistical formulas, chart selection, and error handling for various data scenarios.
Changes include:
- A new combined control chart for continuous data intelligently selects the appropriate control chart set based on the underlying data.
- Updated statistical formulas and constants to better match the needs of pharma and biotechs.
- Smarter selection of charts based on sample size.
- Showing sample sizes for your batch data right on the reports for quick reference.
If you are new to QbDVision and interested in trying out our solution, reach out to learn more about exploring the platform’s expanded capabilities.
